How to A/B Test QR Menu Placement to Boost Scans
Updated:
Why Placement Matters More Than You Think
You've done the work. You built a QR code menu that looks great on mobile, loads fast, and shows off your best dishes with photos. But if guests aren't scanning it, none of that effort pays off. The most common reason people skip a QR menu isn't that they dislike the technology — it's that they never noticed the code, couldn't reach it comfortably, or weren't sure what it was for.
Placement is the silent variable that determines whether your QR menu actually gets used. And like any variable worth caring about, it can be tested. A/B testing QR menu placement isn't complicated or expensive. It just requires a structured approach, a way to track scans, and the discipline to change one thing at a time. This guide walks you through exactly how to do it.
What You're Actually Testing
Before you start moving QR codes around, get clear on what "placement" really means. It's not just physical location — it's a bundle of factors that all affect whether a guest scans:
- Position on the table: Center of the table, edge near the guest, attached to a condiment caddy, or fixed to a wall.
- Height and angle: Flat on the table versus propped up at 45 degrees on a small stand.
- Context clues: Whether the code is accompanied by a short instruction ("Scan to view menu") or just sits there silently.
- Material and format: Printed card, tent card, sticker on the table, laminated insert, or a small acrylic stand.
- Location in the venue: At the table, at the host stand, at the bar, on the door as guests enter, or at the register.
Each of these is a testable variable. The key rule of A/B testing: only change one variable at a time per test. If you change the height and the label text simultaneously, you won't know which one drove the improvement.
Setting Up Trackable QR Codes
You can't test what you can't measure. The foundation of any QR placement test is having scan data you can actually read. Here's how to set that up:
Use unique QR codes per location
Generate a separate QR code for each placement you want to test. Even if all codes point to the same menu URL, using distinct codes (or distinct UTM parameters on the destination URL) lets you count scans per location independently. Most QR code platforms — including MenuHoster's QR code menu generator — let you create multiple codes for a single menu. Do that.
Add UTM parameters to your menu URL
If your QR codes all point to the same base URL, append UTM parameters to differentiate them. For example:
yourmenu.com?utm_source=table&utm_medium=qr&utm_campaign=centeryourmenu.com?utm_source=table&utm_medium=qr&utm_campaign=edge
Then check your analytics (Google Analytics, Plausible, or whatever your menu platform provides) to see which variant got more traffic.
Define your measurement window
Run each test for at least two full weeks — ideally three — to account for day-of-week variation. A Tuesday lunch crowd behaves differently than a Friday dinner crowd. You need enough data from each service type before drawing conclusions.
Choosing Your First Test
Don't try to test everything at once. Pick the placement variable most likely to move the needle based on what you're already observing. Here are the highest-impact starting points:
Flat vs. propped-up QR codes
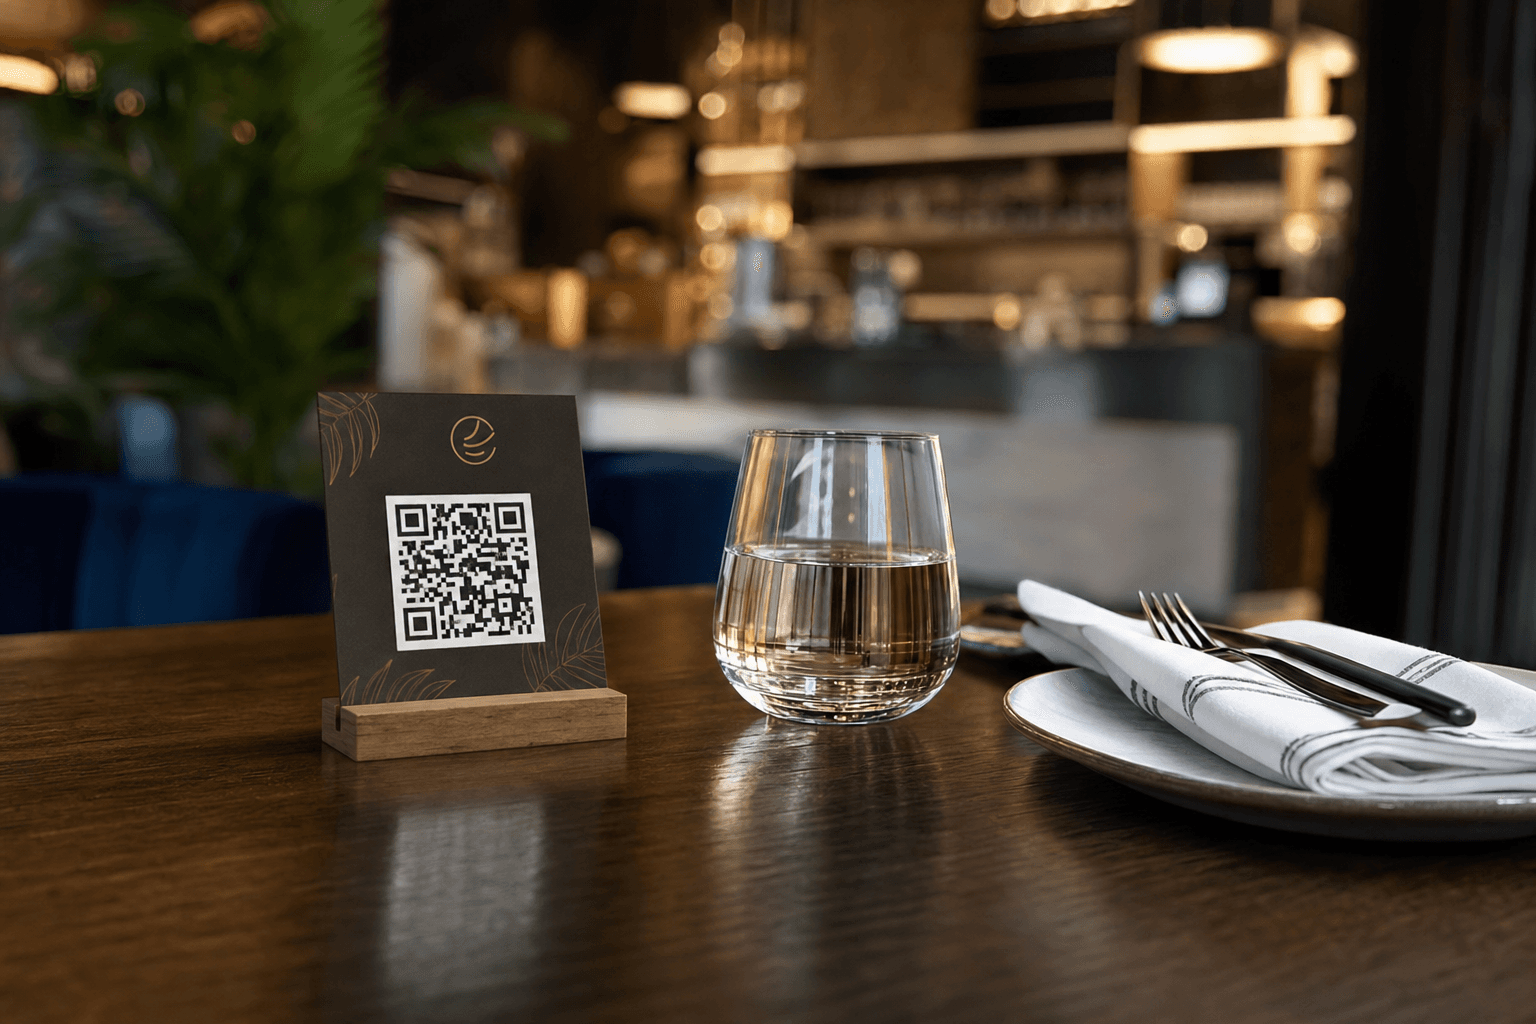
A QR code lying flat on a table is easy to miss, especially in dim lighting. A small tent card or acrylic stand that props the code up at an angle puts it in the guest's natural line of sight when they sit down. This is one of the most consistently impactful changes operators report. Test it first.
How to run it: Split your tables into two groups. Half get flat printed cards; half get tent stands. Use different QR codes for each group. After three weeks, compare scan counts.
Table center vs. near-guest edge
A QR code in the center of a four-top table is equidistant from everyone — which often means no one reaches for it. Placing it closer to the guest (near the edge of the table on the seated side) reduces the physical effort required to scan. Less friction = more scans.
With instructions vs. without
A plain QR code tells guests nothing. Adding a single line — "Scan to view our full menu" — removes ambiguity. Test a version with a clear call-to-action label against one without. You may be surprised how much a four-word prompt matters.
Table placement vs. host-stand placement
Some operators find that putting a QR code at the host stand (where guests wait to be seated) primes people to open the menu before they even sit down. By the time they're at the table, they're already browsing. This works especially well during busy periods when servers are stretched thin.
Running the Test Cleanly
A/B testing in a physical environment is messier than online testing. Here's how to keep your results meaningful:
Assign tables, not time periods
Don't run Variant A on Monday and Variant B on Tuesday. Day-of-week and meal-period differences will corrupt your data. Instead, run both variants simultaneously on different tables. Assign your test tables to groups randomly — not by section, which can introduce server behavior as a confounding variable.
Brief your staff
Your servers need to know the test is running and what it involves. They shouldn't be repositioning QR codes, placing physical menus on test tables out of habit, or verbally directing guests away from scanning. If staff behavior changes between tables, your data is noise. A quick pre-shift briefing is enough — you don't need to make it a big deal. For a more thorough approach to staff alignment, see our guide on rolling out QR menus to your team.
Control for table size and type
Don't compare scans from a two-top (where the QR code is always within reach) against a large booth (where it might be shoved to one end). Match table types between your A and B groups as closely as possible.
Track secondary metrics too
Scan count is your primary metric, but also track:
- Time-to-order: Are guests ordering faster from tables where scans are higher?
- Average check size: A well-placed digital menu that guests actually browse can lift spend — especially if your digital menu includes photos, descriptions, and upsell prompts.
- Server call frequency: Fewer "what do you have?" questions from guests who've already browsed the menu is a real operational win.
Interpreting Your Results
After your measurement window closes, pull your scan data and compare. A few rules for reading the results honestly:
- Look for meaningful differences, not tiny ones. If Variant A got 48 scans and Variant B got 51, that's noise. If Variant A got 40 and Variant B got 70, that's a signal worth acting on.
- Check for confounding events. Did a local event drive unusual traffic on certain days? Did a staff member get sick and leave one section understaffed? Flag these periods and consider excluding them.
- Don't declare victory too early. Two weeks is a minimum. Three is better. Resist the urge to call a winner after three days of data.
Once you have a clear winner, roll it out across all tables and move on to your next test. Over time, each incremental improvement compounds. A 20% lift from better positioning plus a 15% lift from adding a call-to-action label adds up to a meaningfully different scan rate than where you started.
Beyond the Table: Other Placements Worth Testing
Tables are the obvious starting point, but QR menu placement extends throughout your venue and beyond it. Once you've optimized your table setup, consider testing these:
Front door and window
A QR code on your front door or window lets passersby browse your menu before committing to coming in. This is especially valuable for cafes and quick-service spots. It also serves as a discovery tool for people who find you online — link your menu QR to your Google Business Profile and social pages. For ideas on where else to share your QR code, see the best places to share your menu QR code online.
Bar and counter areas
Bar guests often sit longer and order in rounds. A QR code at eye level behind the bar, or on a small stand at the bar top, encourages them to browse between rounds rather than waiting to flag down a bartender.
Takeout and pickup area
Guests waiting for takeout orders are a captive audience. A QR code in the pickup area pointing to your menu (or better, your online ordering page) can prompt add-on purchases or encourage them to plan their next visit.
Receipts and packaging
Printing a QR code on your receipt or takeout bag keeps your menu in front of guests after they leave. This is a low-cost placement that's easy to test — just compare return visit rates or online order frequency before and after adding it.
Common Mistakes to Avoid
- Testing too many things at once. You'll end up with data you can't interpret. One variable per test, always.
- Using the same QR code for all placements. If every location uses the same code, you have no way to know which one is driving scans.
- Ignoring the destination experience. Better placement gets guests to scan. What happens after they scan is equally important. Make sure your menu loads fast, looks good on mobile, and is easy to navigate. A slow or confusing menu will undermine even perfect placement.
- Stopping after one test. Placement optimization is ongoing. Guest behavior shifts with seasons, with menu changes, with shifts in your customer mix. Revisit your setup every few months.
- Forgetting low-light conditions. A QR code that scans fine in daylight may be invisible at dinner service. Test your placements at the actual lighting levels your guests experience.
Building a Testing Cadence
The operators who get the most out of QR menu optimization treat it as an ongoing practice, not a one-time project. A simple cadence looks like this:
- Month 1: Establish a baseline. Deploy a consistent placement across all tables with trackable codes. Record your average weekly scan rate.
- Month 2–3: Run your first test (e.g., flat vs. propped). Implement the winner.
- Month 4–5: Run your second test (e.g., with vs. without call-to-action label). Implement the winner.
- Month 6+: Test secondary locations (bar, door, receipt). Continue iterating quarterly.
This isn't a heavy lift. Each test requires about 30 minutes of setup and a few minutes per week to check your data. The payoff — more guests actually using your digital menu, faster table turns, higher average checks — is well worth it.
Frequently Asked Questions
How many tables do I need to run a valid A/B test?
There's no hard minimum, but more tables mean faster, more reliable results. If you have at least 8–10 tables, you can split them evenly and get meaningful data within 2–3 weeks. Smaller venues may need to run tests for a full month to accumulate enough scans to draw conclusions.
Do I need special software to track QR code scans?
Not necessarily. If your menu platform provides per-code scan analytics, use that. Otherwise, you can use unique UTM parameters on your menu URL and track visits in Google Analytics or any web analytics tool. The key is that each physical placement has its own trackable code or URL variant.
What's a good scan rate to aim for?
This varies widely by venue type and guest mix. A reasonable target for a table-service restaurant is 60–75% of tables scanning during a meal period. If you're below 40%, there's almost certainly a placement or visibility issue worth investigating. Cafes and quick-service spots often see lower per-table rates but higher volume overall.
Should I remove physical menus during the test?
That depends on your venue and guest expectations. If you're transitioning to fully contactless, removing physical menus is part of the test. If you're running QR as a supplement, keep physical menus available but track whether tables that scan the QR code also ask for a physical menu — that tells you something about the digital experience.
How do I test placement in a food truck or counter-service setting?
In counter-service environments, the key placements to test are: at the ordering counter (eye level vs. below counter), at the queue entrance, and on signage visible from outside. Use separate codes for each position and track which one drives the most scans during a defined test period. Our dedicated guide on QR code menus for food trucks covers the unique setup considerations in more detail.
Ready to put better placement to work? MenuHoster makes it easy to generate multiple trackable QR codes for your menu, so you can run placement tests without any technical headaches. Create your free QR menu today and start collecting the scan data that turns guesswork into genuine improvements.
MenuHoster Team
Helping restaurants go digital