QR Code Menu Analytics: Which Metrics Actually Matter for Restaurant Growth
Updated:
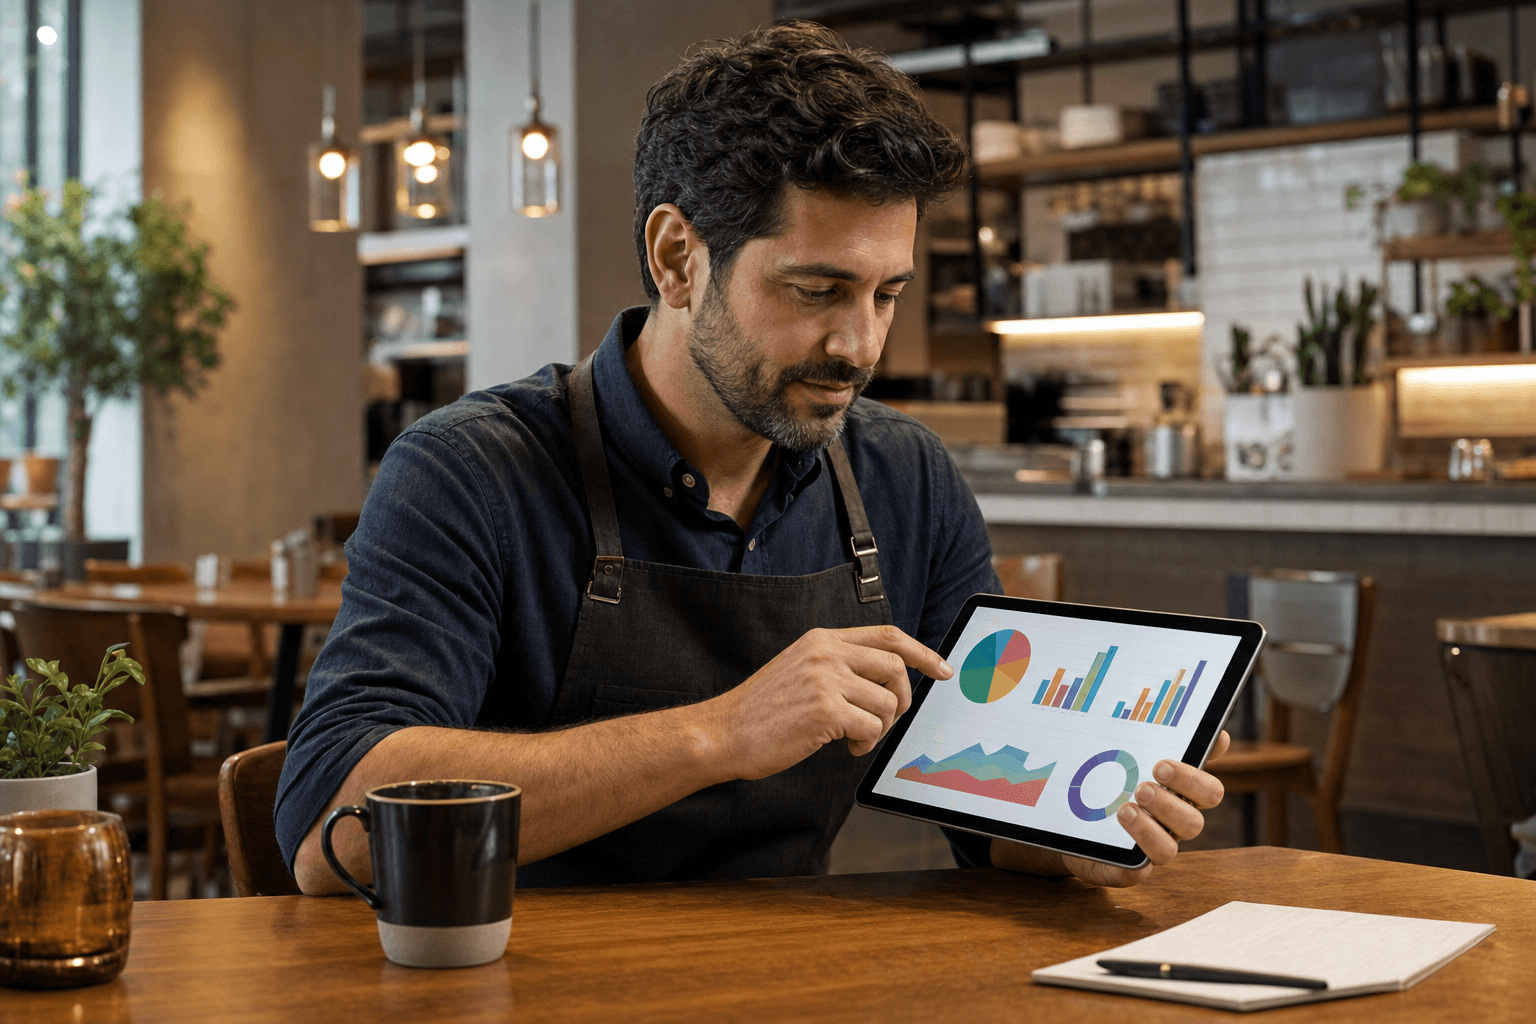
Most restaurant owners who switch to a QR code menu do it for the obvious wins: no printing costs, instant updates, and a cleaner table experience. What they often miss is the data layer sitting underneath. Every time a guest scans your code and browses your menu, they leave behind a trail of behavioral signals—signals that can tell you what's working, what's dead weight, and where you're leaving money on the table.
The problem is that most operators either ignore these metrics entirely or fixate on the wrong ones. Total scans is a feel-good number. It tells you almost nothing about whether your menu is driving revenue. This guide cuts through the noise and focuses on the metrics that actually connect to business outcomes: higher check averages, faster table turns, and more repeat visits.
Why Menu Analytics Matter More Than You Think
A paper menu is a black box. You print it, guests read it, they order—and you have no idea which sections they lingered on, which items they skipped, or at what point they gave up and just asked the server. A digital menu changes that entirely.
When guests interact with your digital menu, you can observe behavior at scale. Aggregate that behavior across hundreds of sessions per week and patterns emerge fast. You'll see which items get viewed but rarely ordered (a pricing or description problem), which categories guests scroll past entirely (a placement or naming problem), and which times of day produce the most engaged sessions (a staffing and upsell opportunity).
The goal isn't to become a data scientist. It's to replace gut-feel decisions with a small set of reliable signals that you check regularly and act on.
The Metrics That Actually Matter
1. Scan-to-Session Rate
A scan happens when a guest points their camera at your QR code. A session happens when they actually load and interact with your menu. These are not the same thing. If you have a high scan count but a low session count, guests are scanning and immediately bouncing—usually because the page loads too slowly, the link is broken, or the mobile experience is poor.
Aim for a scan-to-session rate above 85%. Anything lower is worth investigating. Check your menu's mobile load speed first. A page that takes more than three seconds to load on a mid-range phone loses a significant portion of visitors before they see a single item.
2. Session Duration
How long does a guest spend browsing your menu? A session duration of under 30 seconds usually means one of three things: the guest found what they needed immediately (good), the menu was confusing and they gave up (bad), or they were just checking a price and left (neutral). Sessions between 60 and 180 seconds are the sweet spot—long enough to browse meaningfully, short enough to suggest the menu is clear and well-organized.
If average session duration is very short across the board, look at your menu structure. Are categories clearly labeled? Is the most popular content near the top? A cluttered or overwhelming menu drives guests to ask servers for help instead of engaging with the digital experience.
3. Most-Viewed Items vs. Most-Ordered Items
This is one of the most actionable gaps in menu analytics. When an item gets a lot of views but few orders, something is breaking down between interest and conversion. Common culprits include:
- Price friction: The item looks interesting but the price feels unjustified without a compelling description or photo.
- Weak descriptions: The name is intriguing but the description doesn't close the deal.
- Missing image: Guests want to see what they're getting. Items without photos consistently underperform items with photos, even when the food is equally good.
- Dietary ambiguity: Guests with restrictions won't order something they're unsure about. Clear allergen and dietary labels remove hesitation.
Conversely, items with high order rates but low view counts are buried. Move them up in their category, add a badge like "Popular" or "Chef's Pick," and watch the numbers climb.
4. Category Engagement Rate
Which sections of your menu do guests actually open? If your dessert category has a 12% open rate while your mains sit at 94%, that's a signal—either guests aren't interested in dessert, or the category is so far down the menu that most people never reach it. Test moving desserts higher, or surface a dessert item as a featured recommendation on the landing view of your menu.
Category engagement also reveals whether your menu architecture makes sense. If guests are frequently opening a "Drinks" category but rarely ordering from it, your drink descriptions or pricing may need work.
5. Peak Scan Times
Knowing when your QR menu gets the most traffic is operationally valuable. If 40% of your daily scans happen between 12:00 and 1:00 PM, that's your highest-stakes window. Your menu needs to be fast, your most popular lunch items need to be prominent, and your staff needs to be fully briefed on current availability.
Peak scan data also informs promotion timing. If you want to push a new item or a limited-time special, launching it just before your peak window means maximum eyeballs on day one.
6. Device and Platform Breakdown
What percentage of your guests are on iOS vs. Android? What screen sizes are most common? This matters because your menu needs to render correctly across all of them. If a disproportionate share of your guests are on Android and you've only ever tested your menu on an iPhone, you may be serving a broken or degraded experience to a majority of your customers without knowing it.
Check this quarterly and test your menu on the most common devices your guests actually use.
7. Return Scan Rate
Are guests scanning your QR code on repeat visits? A healthy return scan rate suggests guests are comfortable with the digital experience and coming back to your restaurant. It's a proxy for loyalty. If your return scan rate is very low, it could mean you're primarily serving one-time visitors—or it could mean guests remember your menu from last time and don't feel the need to look again (which is actually fine for regulars).
Context matters here. A tourist-heavy location will naturally have a lower return scan rate than a neighborhood lunch spot. Benchmark against your own historical data rather than industry averages.
Metrics That Look Important But Aren't
Not every number in your analytics dashboard deserves your attention. Here are three common distractions:
- Total scan count: A vanity metric on its own. 500 scans a week means nothing if sessions are short, orders are low, and check averages haven't moved. Always pair scan volume with engagement and conversion data.
- Bounce rate in isolation: Some bounces are fine. A guest who scans, checks the hours or a single price, and leaves isn't a failure—they got what they needed. A high bounce rate only becomes a problem when it correlates with low order volume or short dwell time.
- Social shares of your menu: Unless you've built a specific sharing mechanism into your menu, this metric is rarely meaningful for a restaurant's day-to-day operations. Focus on in-venue behavior first.
How to Use Analytics to Engineer a Higher Check Average
This is where menu analytics pays off directly. Once you know which items guests view and which they order, you can engineer the menu to guide guests toward higher-margin choices.
Identify high-margin items with low visibility
Cross-reference your menu analytics with your POS data. Find items that have strong margins but low view counts. These are candidates for repositioning—move them earlier in their category, add a photo, improve the description, or surface them as a featured item at the top of the menu.
Spot natural upsell moments
If guests frequently view a main course and then immediately navigate to the drinks category, that's a natural pairing. Build that connection explicitly into the menu by adding a "Pairs well with" suggestion on the item page. A well-placed upsell prompt on a digital menu can lift check averages by 10–20% without any additional staff effort.
Test and measure changes systematically
Don't change five things at once and then try to figure out what worked. Make one change—move an item, update a description, add a photo—and give it two weeks before evaluating. A/B testing your menu layout and pricing is a disciplined way to do this without guesswork. Track the relevant metric (views, orders, or check average for that item) before and after, and let the data tell you whether the change worked.
Connecting Menu Analytics to Your Broader Marketing
Your QR menu analytics don't exist in a vacuum. They're most powerful when connected to what's happening in the rest of your business.
If you're running a promotion—say, a new seasonal dish or a weekend special—your menu analytics can tell you immediately whether guests are finding and engaging with it. Low views on a promoted item often mean the placement is wrong, not that the item itself is unappealing.
Similarly, if you've been collecting customer feedback through your digital menu, you can correlate feedback scores with specific items or menu sections. A cluster of negative feedback around a particular dish, combined with a high view-to-low-order ratio, is a strong signal that something needs to change.
For operators tracking broader marketing performance, menu analytics also help you understand which traffic sources convert. If you're sharing your menu link on Instagram or Google Business Profile, UTM parameters let you see which channel drives the most engaged menu sessions—not just the most clicks. That's the kind of insight that helps you spend your marketing budget more intelligently, as covered in our guide to measuring restaurant marketing ROI without fancy tools.
Building a Simple Analytics Review Routine
The best analytics practice is one you'll actually stick to. Here's a lightweight routine that works for most independent operators:
- Weekly (10 minutes): Check scan volume, session duration, and top-viewed items. Flag anything that looks unusual—a sudden drop in scans could mean a broken QR code or a link issue.
- Monthly (30 minutes): Compare most-viewed vs. most-ordered items. Identify one or two items to reposition or improve. Check peak scan times against your staffing schedule.
- Quarterly (1 hour): Review device breakdown, return scan rate, and category engagement. Evaluate whether any menu structural changes are needed. Assess whether your pricing on high-view/low-order items needs adjustment.
This rhythm keeps you informed without turning menu management into a second job. The goal is to make small, data-informed improvements consistently—not to overhaul everything at once.
What Good Analytics Infrastructure Looks Like
You don't need enterprise software to get meaningful data from your QR menu. What you do need is a platform that captures the right events and presents them in a usable format. When evaluating your setup, look for:
- Item-level view and interaction tracking (not just page-level)
- Session duration and depth data
- Device and platform breakdown
- Time-of-day and day-of-week segmentation
- The ability to tag and track menu changes over time
If your current setup only shows you total scans, you're flying blind. A proper contactless menu platform should give you enough behavioral data to make real decisions—without requiring a data analyst to interpret it.
Frequently Asked Questions
How many scans do I need before menu analytics are meaningful?
You generally need at least 200–300 sessions per metric period before patterns become statistically reliable. For a busy restaurant, that might be a week's worth of data. For a quieter spot, give it a month before drawing conclusions from item-level data.
Do I need to tell guests I'm tracking their menu interactions?
This depends on your jurisdiction and the type of data collected. Aggregate, anonymized behavioral data (like item view counts and session durations) typically doesn't require explicit consent. However, if your platform collects personally identifiable information or uses cookies, you should display a privacy notice. Check with your platform provider and, if in doubt, consult a local attorney familiar with privacy regulations in your area.
Can QR menu analytics replace my POS data?
No—they complement each other. Your POS tells you what was ordered and what revenue was generated. Your menu analytics tell you what guests considered before ordering. The most valuable insights come from combining both: identifying items that are viewed frequently but ordered rarely, or categories that drive strong revenue despite low browse rates.
What should I do if my scan-to-session rate is low?
Start with the basics: test your QR code on multiple devices to make sure it resolves correctly, check your menu's mobile load speed using Google PageSpeed Insights, and verify the landing experience is clean and immediately useful. If the code works and the page loads fast, the issue may be QR code placement—codes that are hard to see, poorly lit, or positioned awkwardly on the table get scanned less reliably.
How often should I update my menu based on analytics?
Make small, targeted changes monthly and evaluate them over a two-to-four week window before making the next change. Avoid making multiple simultaneous changes—you won't be able to attribute results accurately. Larger structural overhauls (reorganizing categories, redesigning the menu flow) are worth doing quarterly or seasonally, not in response to a single week of data.
Ready to put real data behind your menu decisions? MenuHoster's QR code menu platform gives you the analytics, flexibility, and ease of use to turn every guest interaction into a growth opportunity. Start building your smarter menu today—no design skills or technical setup required.
MenuHoster Team
Helping restaurants go digital